The Campaign Performance page in the analytics section gives you visibility into how your reward campaigns are performing. It shows who is being reached, how many customers are completing campaigns, and the rewards they are earning through points and coupons. With this data, you can assess the effectiveness of your campaigns and identify which strategies drive the most engagement. Learn more The Customers Behaviour & Engagement page in the analytics will give you insights into your customers’ behavior to better tailor your loyalty and retargeting strategy on Gameball.

Where to Find the Campaign Performance Analytics Page

Go to Gameball Dashboard, and click Analytics from the left bar. Click on the Campaign Performance page.
Campaign performance navigation

What Is the Campaign Performance Analytics Page About?

The Customer Behaviour & Engagement analytics section gives you a detailed insight into how your customers are interacting with the deployed engagement programs using Gameball. It, therefore, leaves you with more knowledge of how Gameball is impacting your business and how it is contributing to achieving your targets and business goals. Campaign Performance analytics provides you with insights into the reach and success of your reward campaigns. You can track how many customers interact with your campaigns, measure completion rates, monitor reward costs, and identify which campaigns drive the highest engagement. Here is the explanation of each piece of information on the Campaign Performance page:
  • Reward Campaign Reach: Number of members targeted by reward campaigns.
Reward campaign reach
  • This shows the size of your audience for each campaign. A higher reach indicates campaigns are widely visible, but effectiveness depends on how many of these members actually participate and complete the campaign.
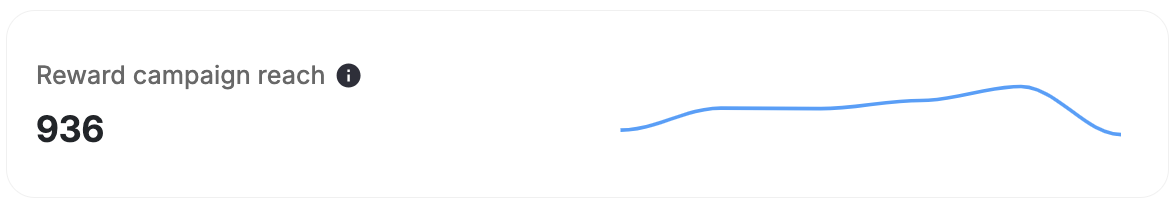
  • Total Customers Achieved Reward Campaigns: Number of members who completed reward campaigns.
Total customers achieved campaigns
  • This measures how many customers successfully fulfilled the requirements of your campaigns. Tracking this helps you understand actual engagement levels and whether campaign goals are realistic and motivating.
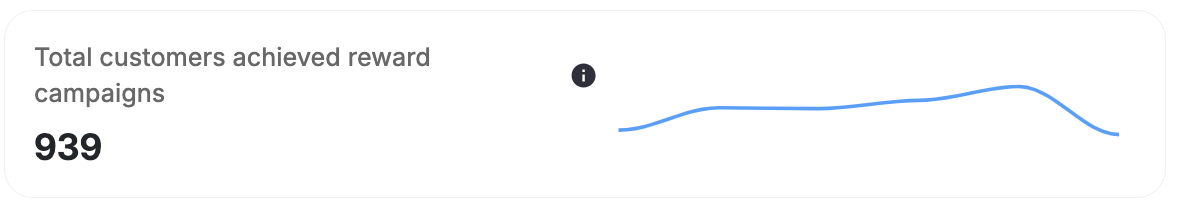
  • Cost of Campaigns in Points Trend: Total points spent on reward campaigns.
Cost of campaigns in points
  • This tracks how many loyalty points have been distributed through campaigns over time. Monitoring this trend ensures your reward costs remain sustainable while still providing enough incentives to drive participation.
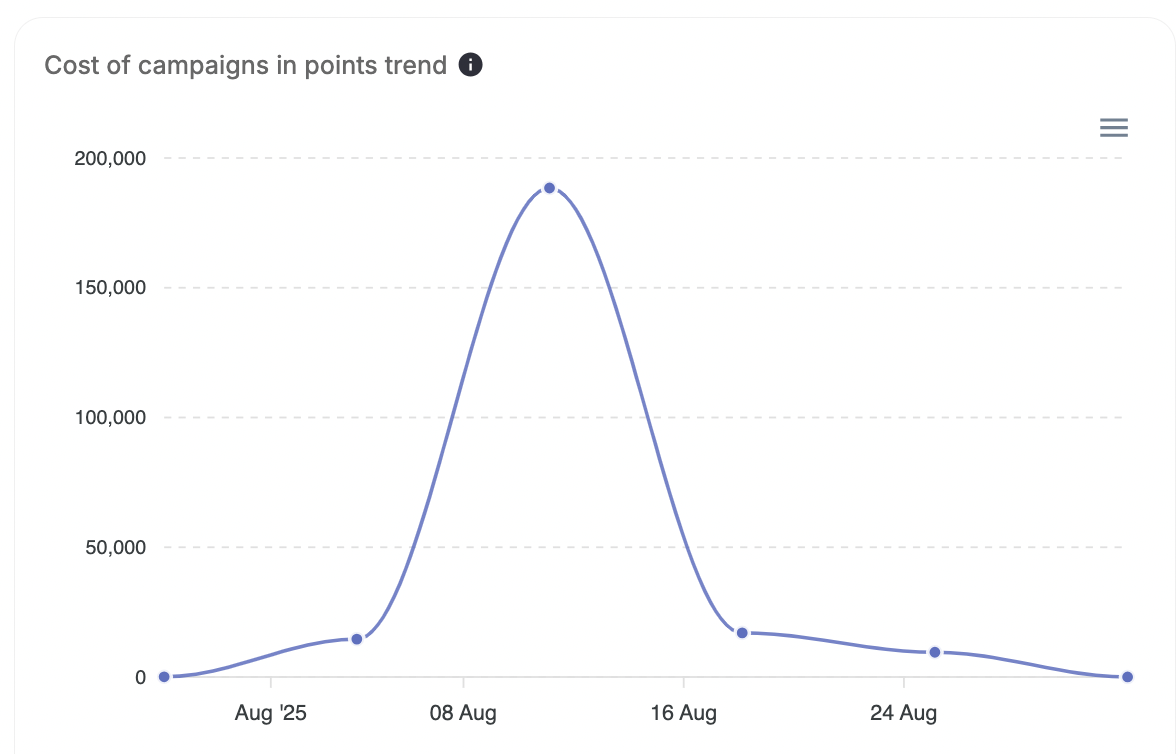
  • Number of Coupons in Campaigns: Tracks the campaign number of coupons over time.
Number of coupons in campaigns
  • This shows the volume of coupons issued through campaigns. A rising trend might indicate growing adoption of coupon-based rewards, while a decline could highlight a need to adjust coupon appeal.
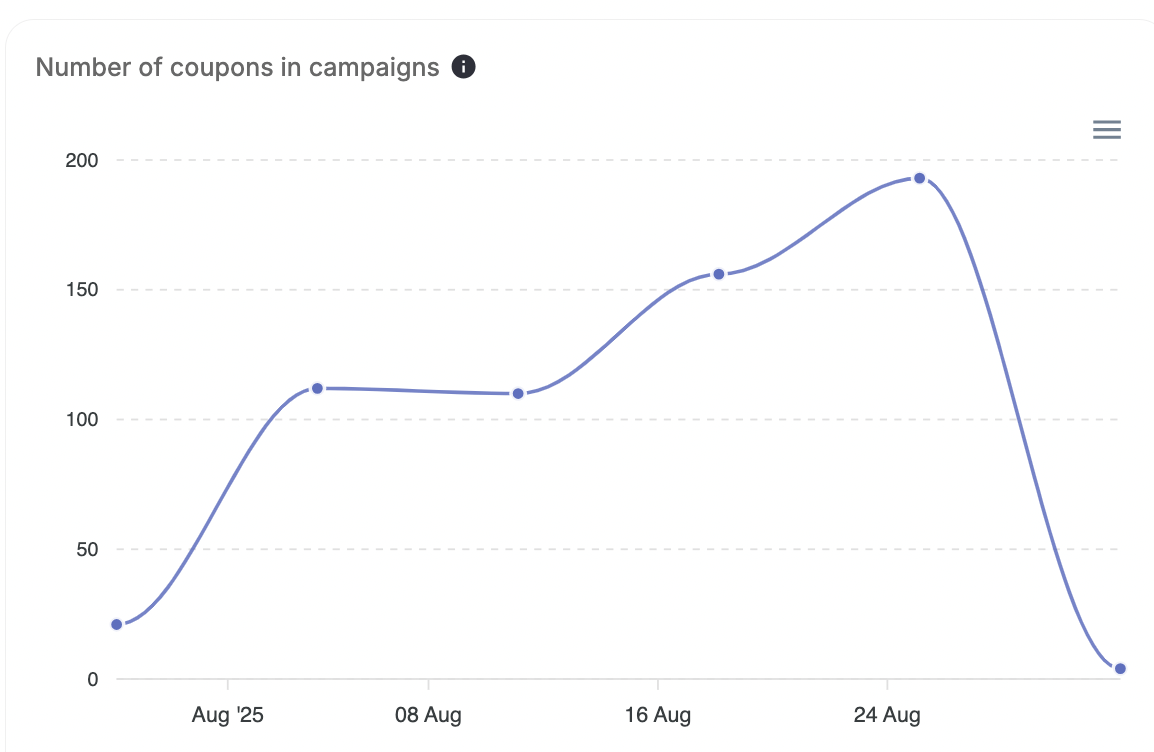
  • Top Reward Campaigns Achieved: Most successful campaigns are based on completion rates.
Top reward campaigns achieved
  • This identifies which campaigns resonated most with your customers, based on how many participants reached the finish line. Studying these campaigns can help you replicate success in future campaigns.
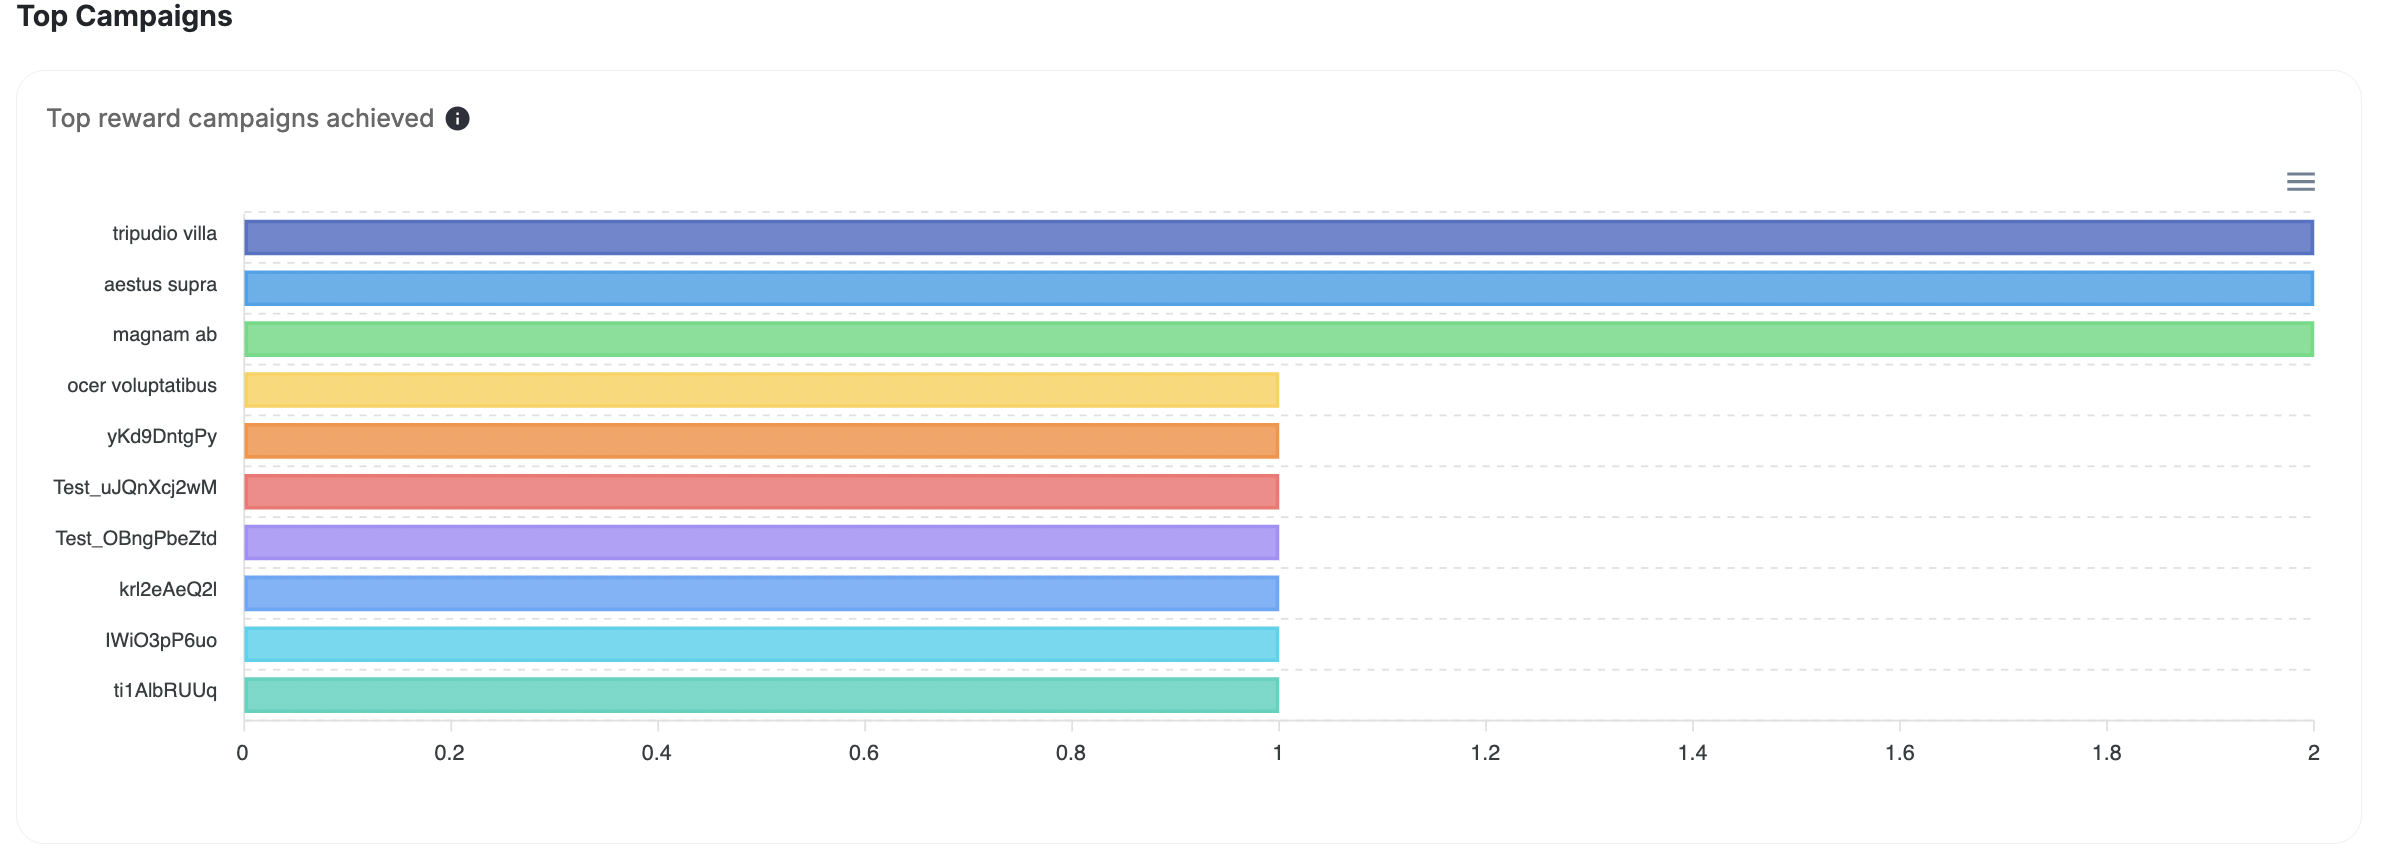
  • Top Points-Earning Campaigns: Top campaigns that give the most number of points.
Top points-earning campaigns
  • This highlights the campaigns that are most generous with points. It helps you evaluate whether points-heavy campaigns are driving meaningful engagement or if adjustments are needed to balance cost and impact.
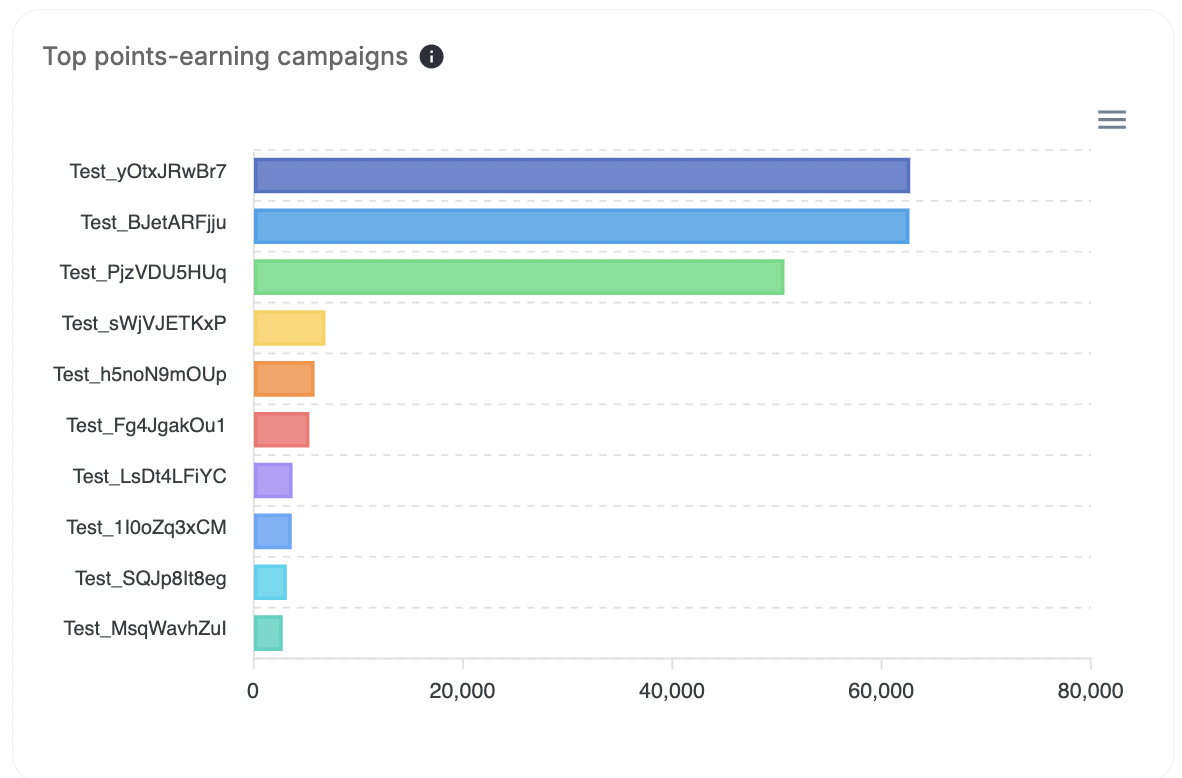
  • Top Coupon-Earning Campaigns: Top campaigns that give the most number of coupons.
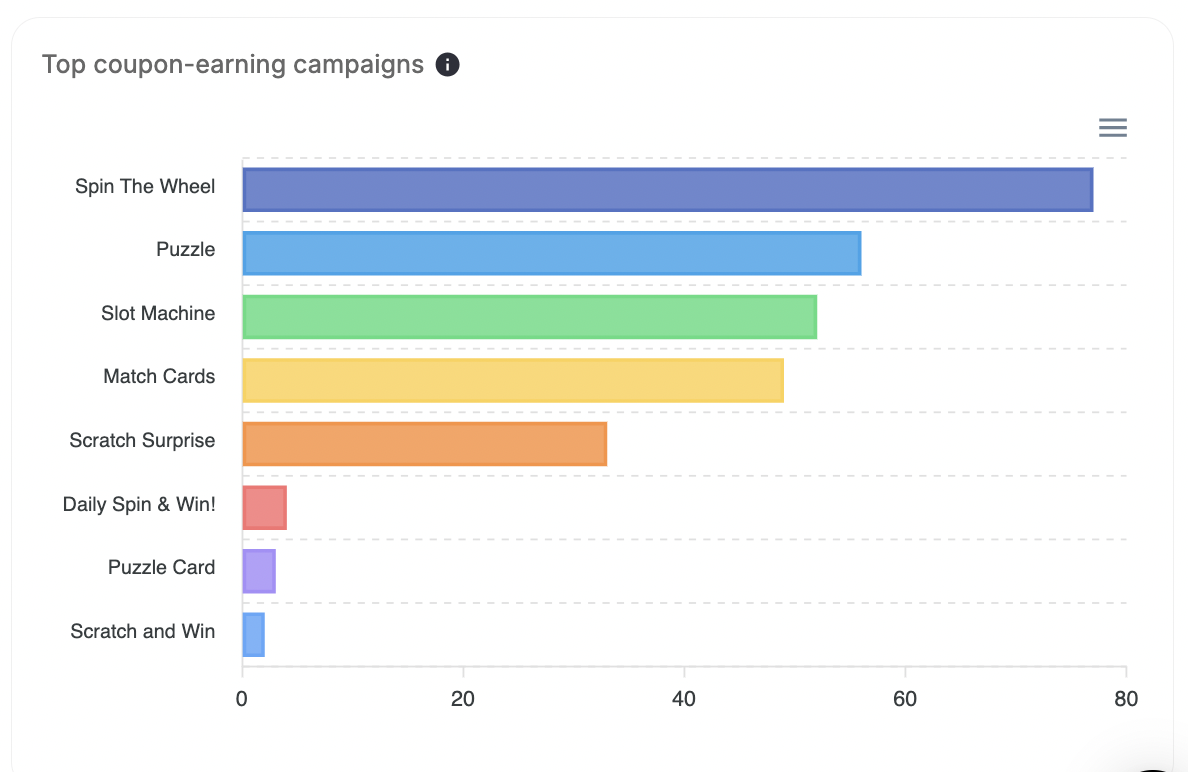
Top coupon-earning campaigns
  • This shows which campaigns issued the most coupons to customers. Reviewing these results allows you to assess if coupon-based rewards are effectively motivating customers to complete campaigns.

What’s Next?