| Platform | Plan |
|---|---|
| Shopify | Pro and Guru |
| Self Serve | All |
Where to Find Insights for Every Reward Campaign
Navigate to Rewards
From the left bar, click Rewards under Campaigns. Then choose any created campaign from the list.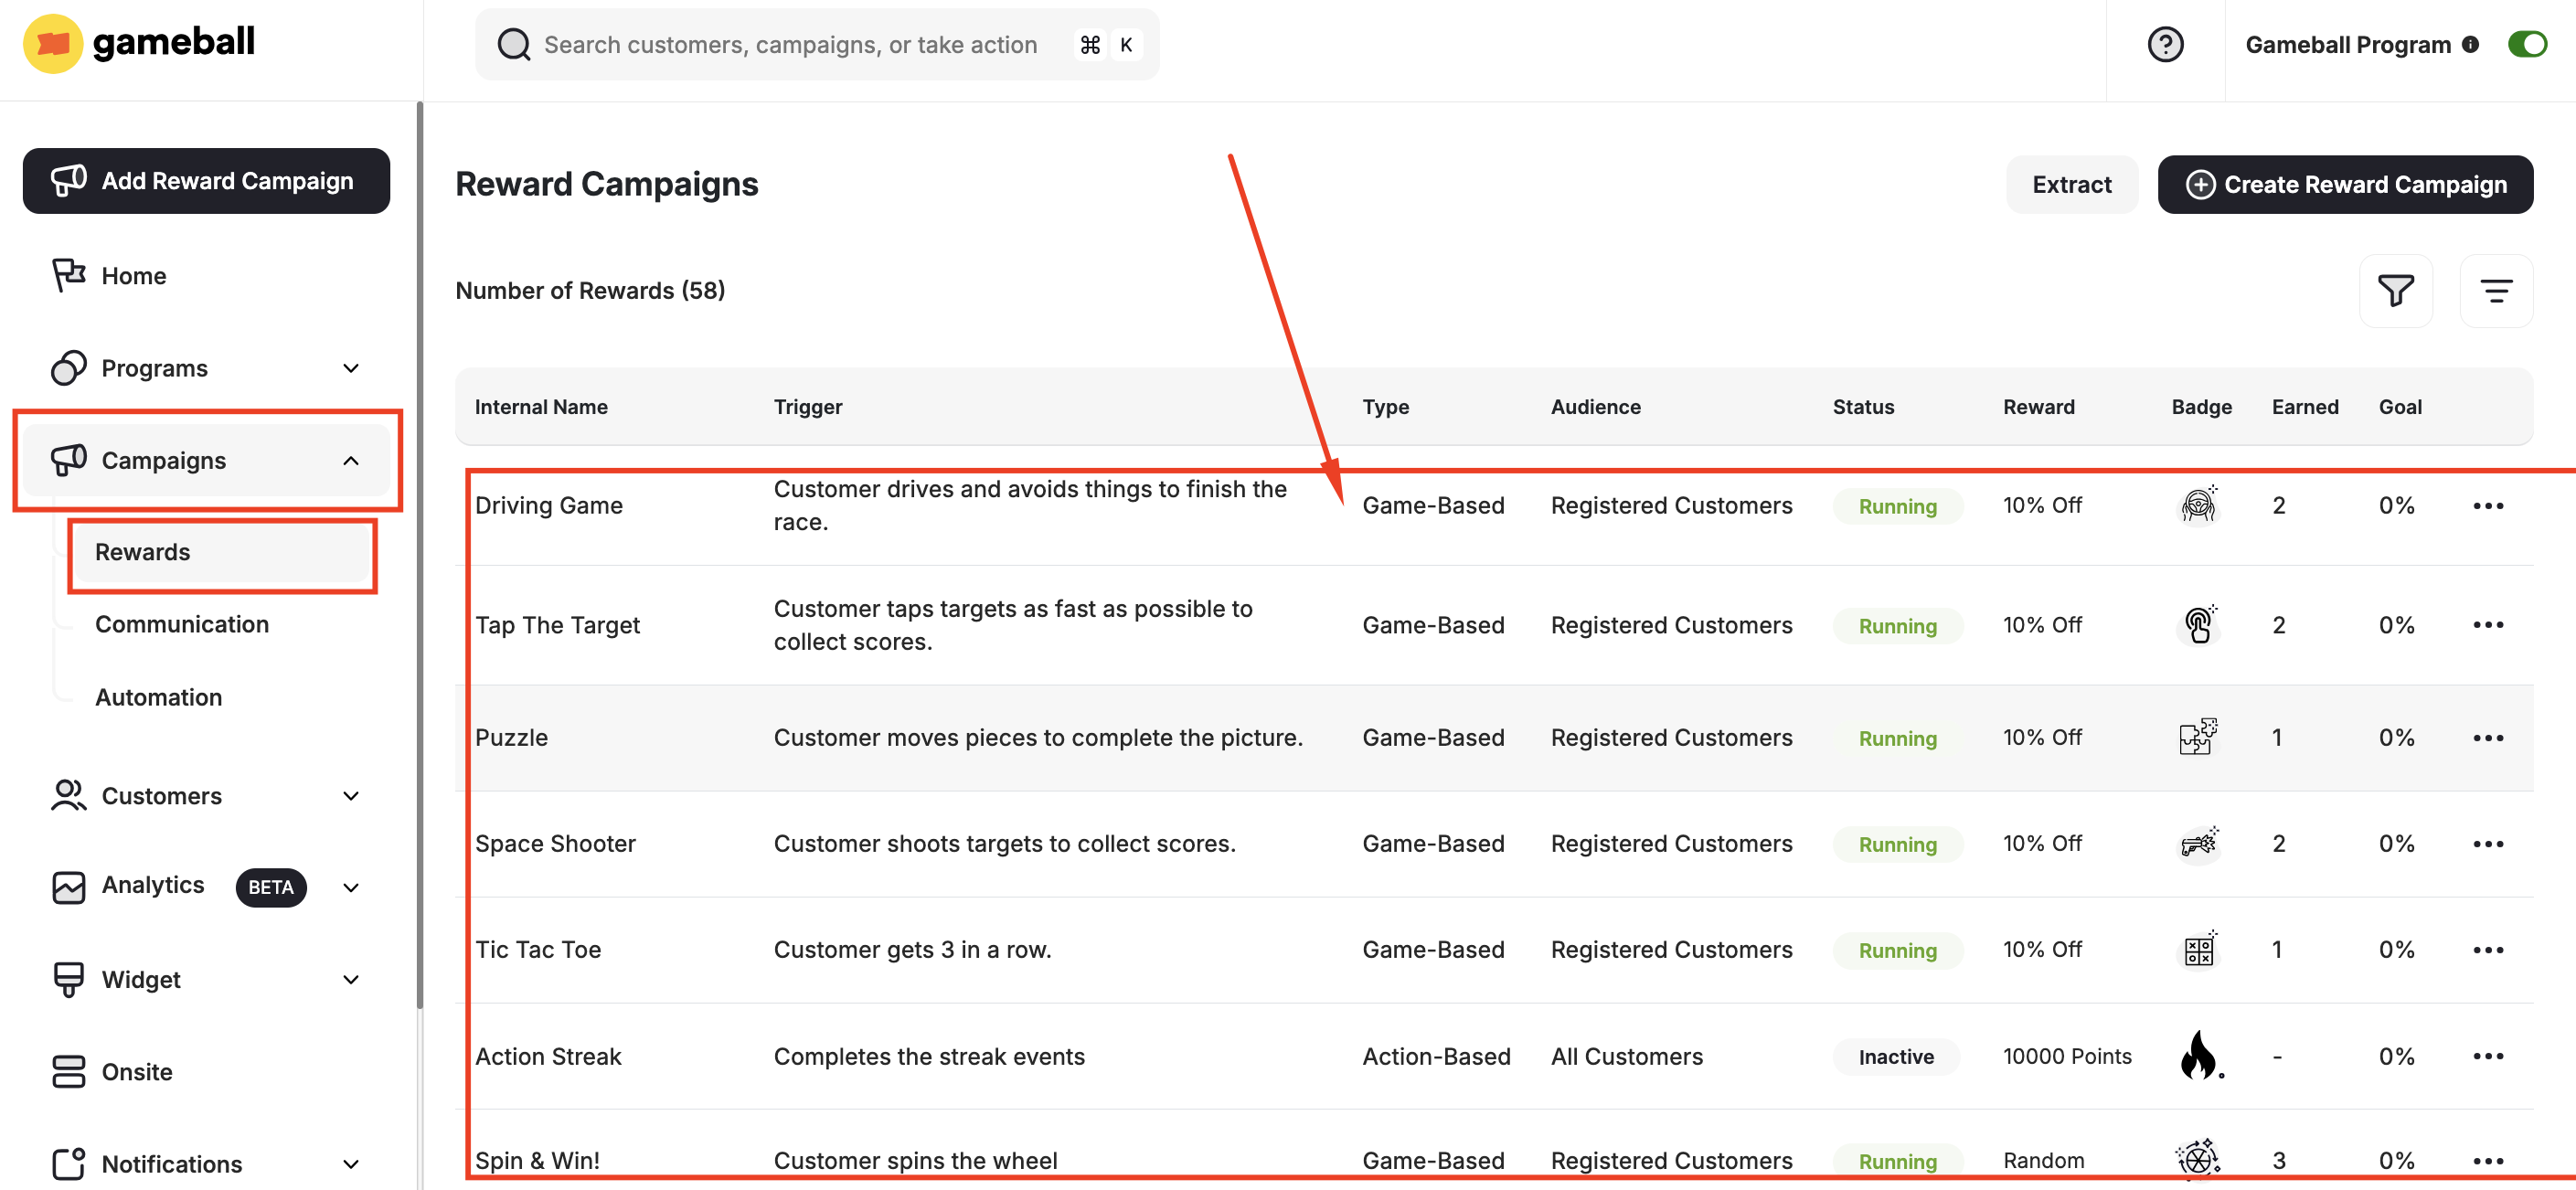
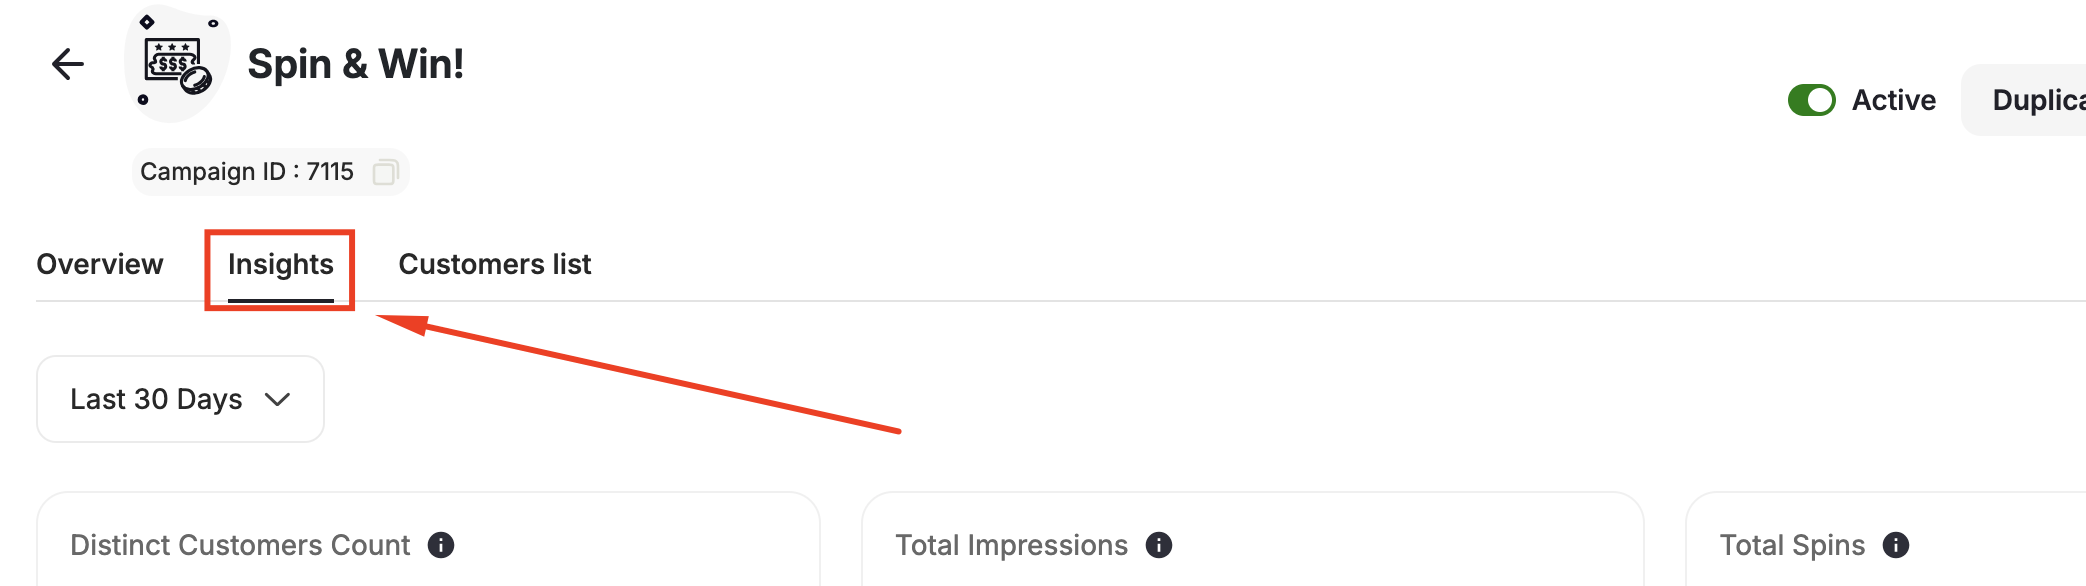
Insights Explanation
Here’s a breakdown of the key metrics available for you to evaluate the performance of your reward campaigns:Campaign Completion Rate
Campaign Completion Rate
This metric measures the percentage of customers who successfully completed the campaign compared to the total number of customers the campaign was sent to. It is calculated using the equation:Number of customers completed the campaign / Total number of customers the campaign was sent to.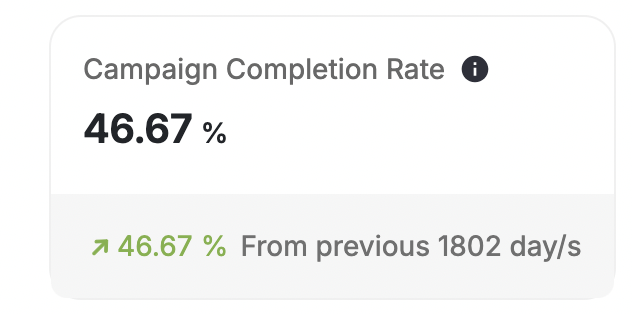
Campaign Abandonment Rate
Campaign Abandonment Rate
The abandonment rate is the inverse of the completion rate and represents the ratio of customers who abandoned the campaign without completing it.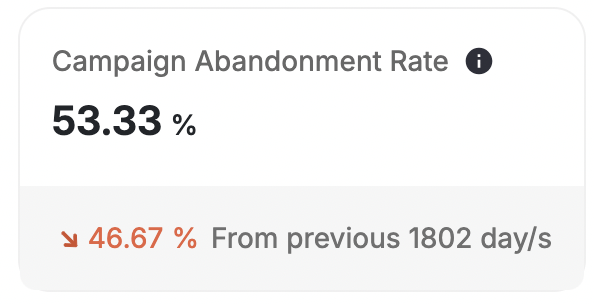
Distinct Customers Count
Distinct Customers Count
This metric indicates the total number of unique customers who participated in the campaign.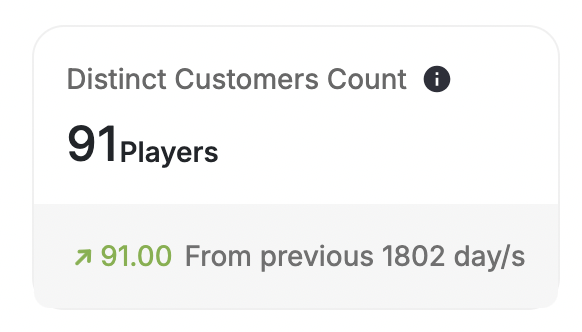
Total Customer Count
Total Customer Count
The total times customers participated in the campaign. It represents the overall level of engagement generated by the campaign.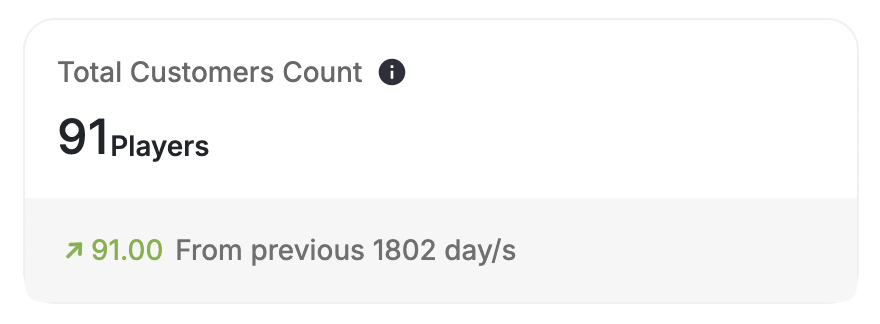
Total Rewarded Points
Total Rewarded Points
The aggregate sum of points awarded to customers through the campaign. It reflects the total incentive provided to participants.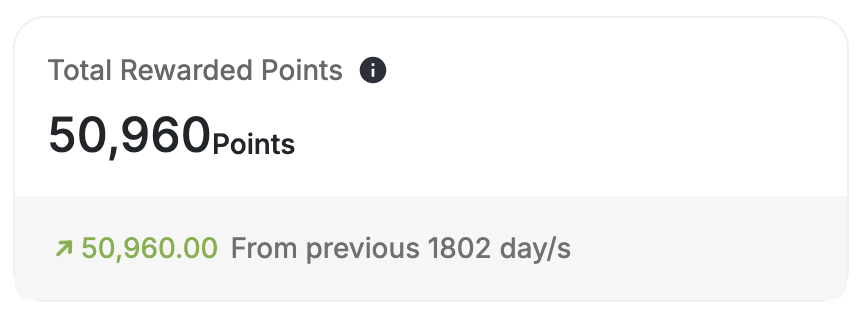
Total Rewarded Coupons
Total Rewarded Coupons
Similar to points, this metric represents the total number of coupons distributed as rewards during the campaign.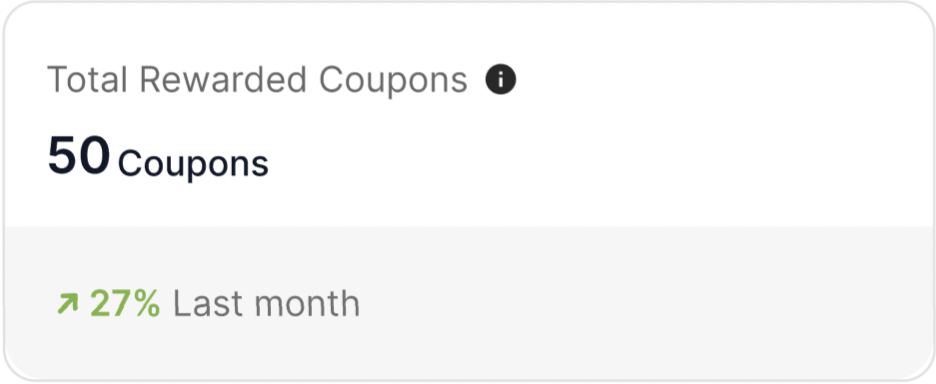
Total Rewarded Points Value
Total Rewarded Points Value
This metric provides both the total points awarded and their corresponding monetary value. It offers insight into the tangible benefits customers receive from participating in the campaign.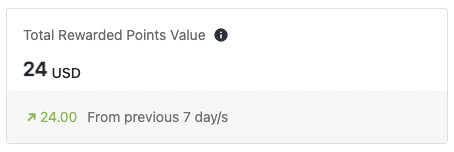
Campaign Participation Rate Over Time
Campaign Participation Rate Over Time
This graph visualizes the trend of campaign participation rates over a specific period. It helps identify any variations or patterns in customer participation.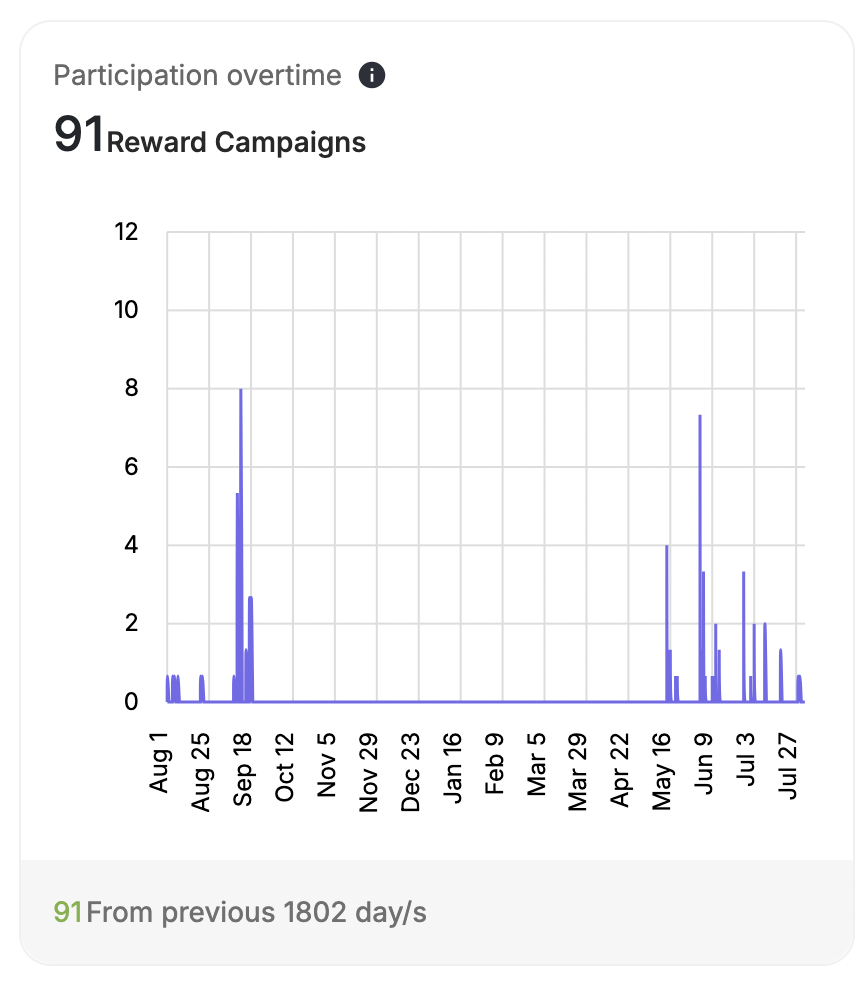
Campaign Rewards Over Time
Campaign Rewards Over Time
Similarly, this graph tracks the number of customers completing the campaign over time. It allows for a continued analysis of campaign effectiveness.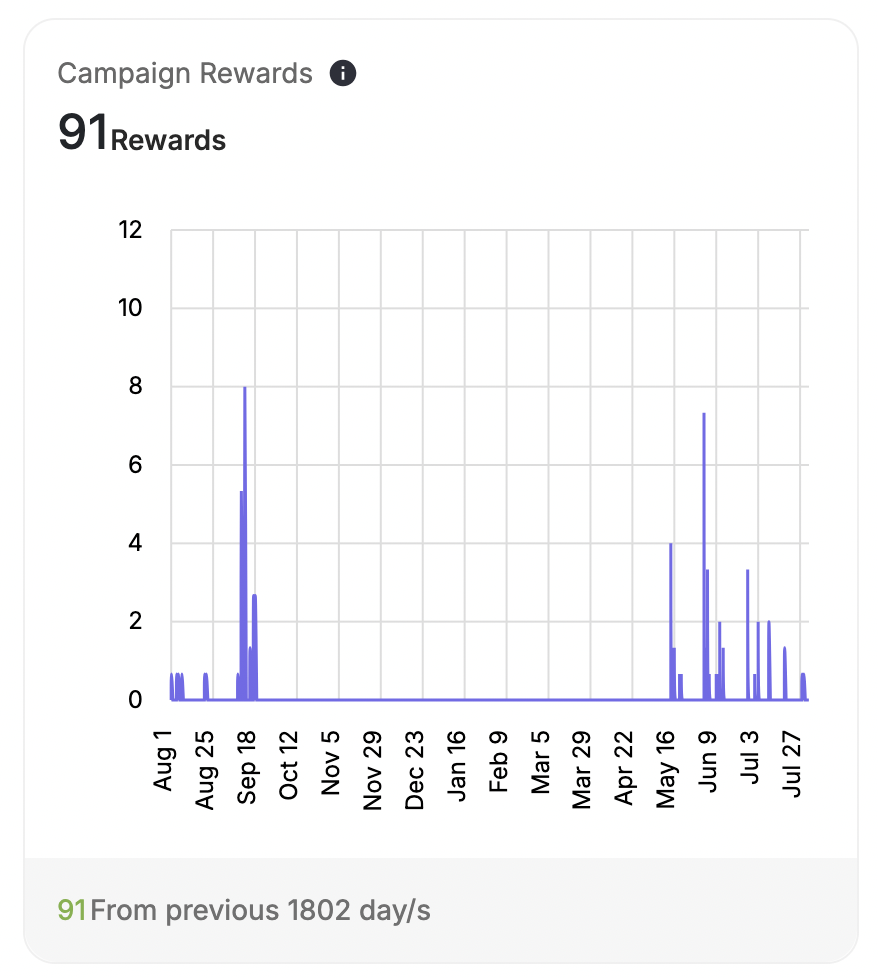
Funnel Analytics Insights
Game Funnel Analytics is an insights module that gives you a clear, step-by-step view of how your customers interact with every game campaign, across all game types, entry methods, and user types. This funnel helps you understand where customers engage, where they drop off, and how effectively your game campaigns drive conversions.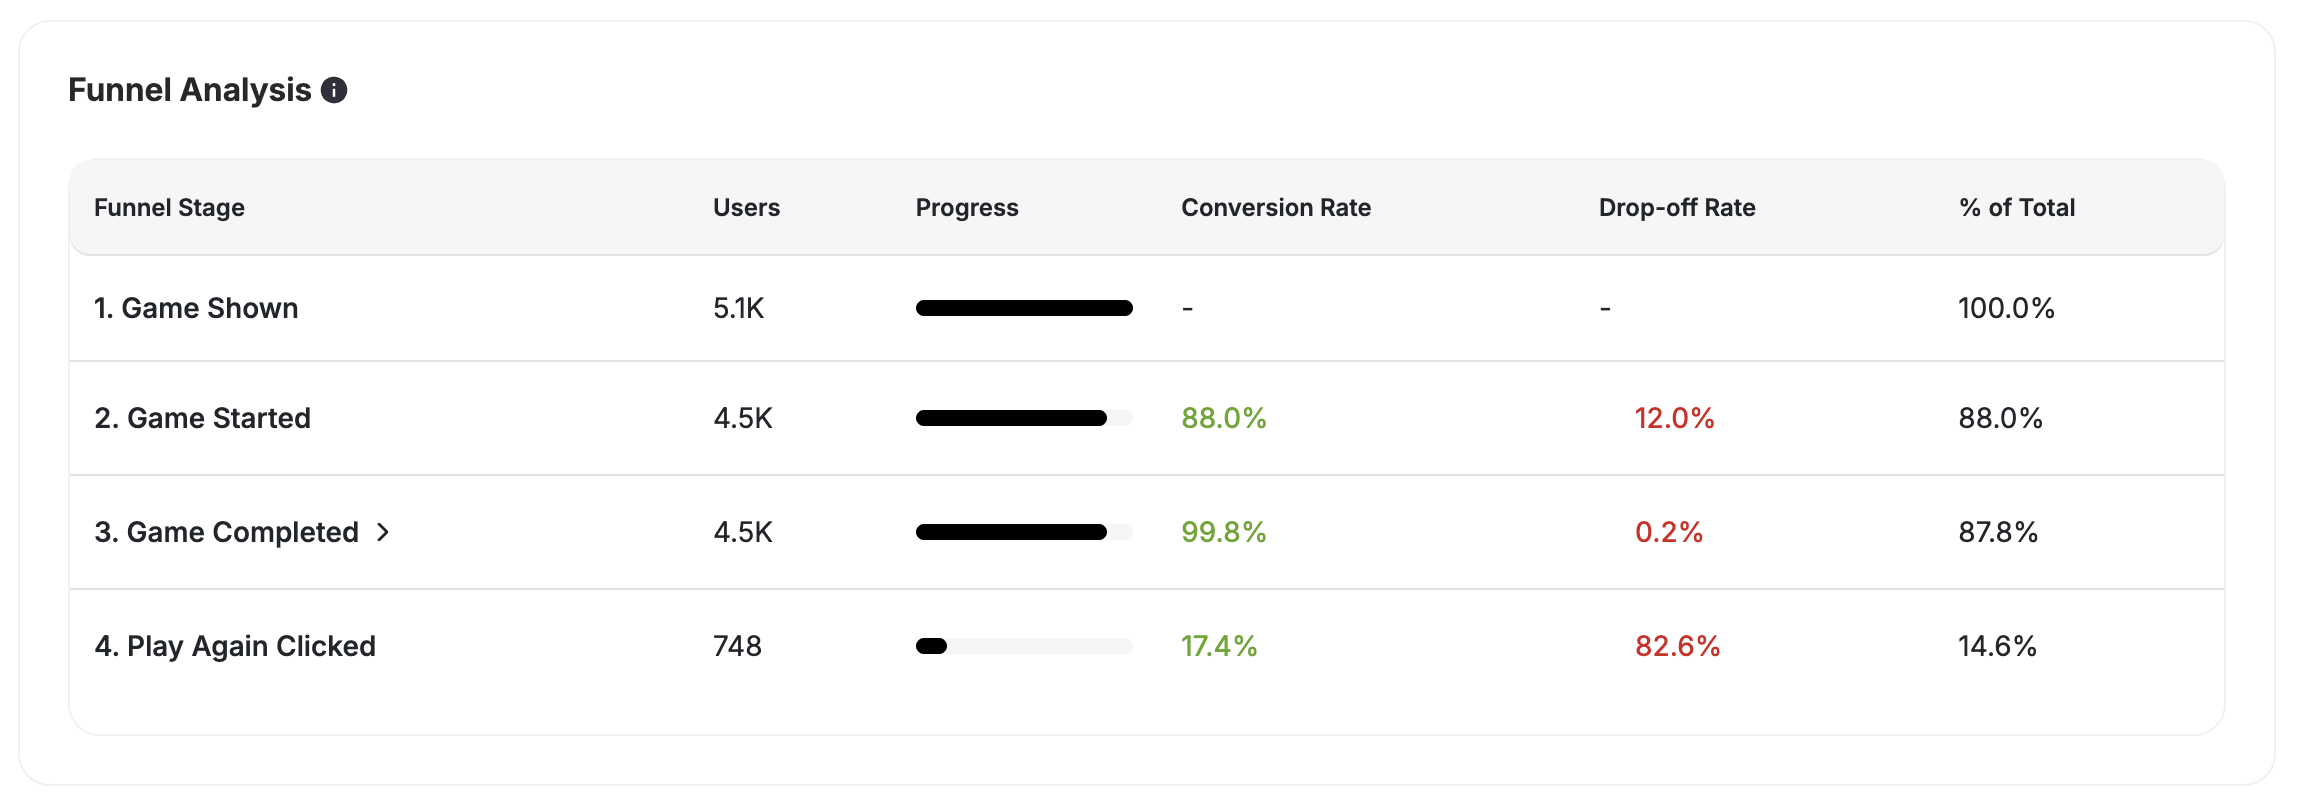
Supported Game Types and Entry Methods
Unified Funnel Tracking for All Game Types Game Funnel Analytics supports all Gameball games, including:Spin and Win
Full funnel tracking for spin wheel campaigns.
Slot Machine
Full funnel tracking for slot machine campaigns.
Scratch Card
Full funnel tracking for scratch card campaigns.
Memory Match
Full funnel tracking for match card campaigns.
The Catcher
Full funnel tracking for catcher game campaigns.
Quiz
Funnel-only insights added for quiz campaigns.
- Widget
- Deep link / direct URL
- Popup trigger
- Manual open
Funnel Stages Tracked
Each game campaign includes a consistent set of funnel steps:What Each Stage Shows
Each funnel stage displays the following data:- Total customers
- Conversion rate to the next step
- Drop-off visualization
- Filtering aligned with the campaign’s date filter
- Total Participated = top-most tracked event.
- Goal Completed = customers who reached the last tracked step.
- Total Conversion = Completed / Started.
Conversion and Drop-Off Logic
| Scenario | Example |
|---|---|
| Step Conversion | 1,000 opened → 750 started = 75% conversion. |
| Step Drop-Off | 25% dropped between “Opened” → “Started.” |
| Overall Conversion | 1,000 opened → 200 reached the goal = 20% overall conversion. |
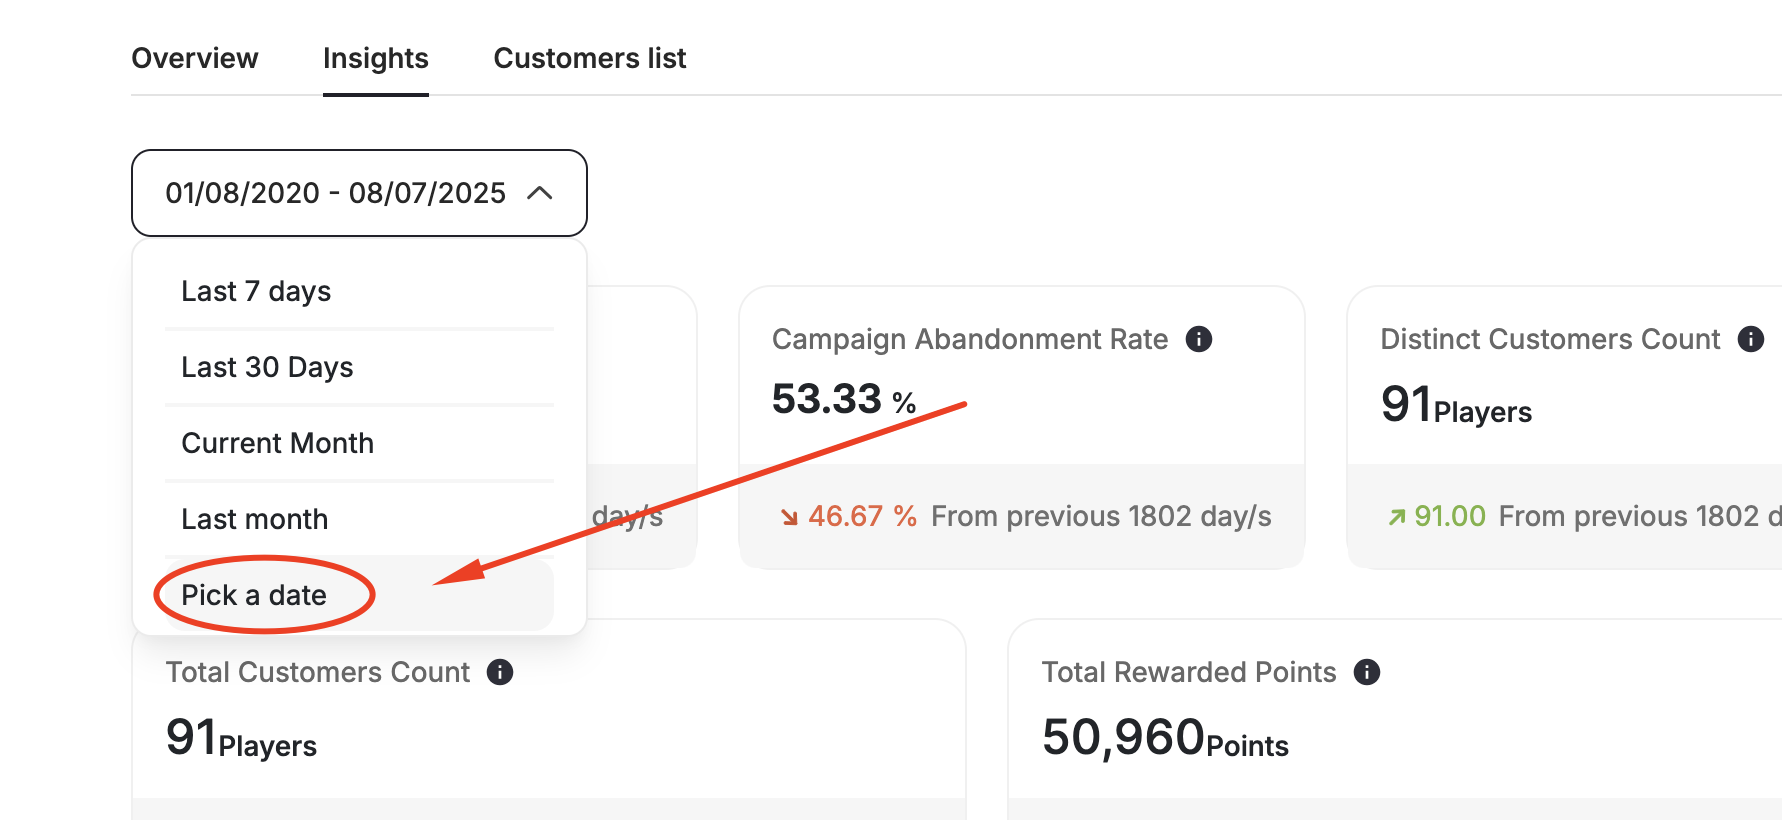
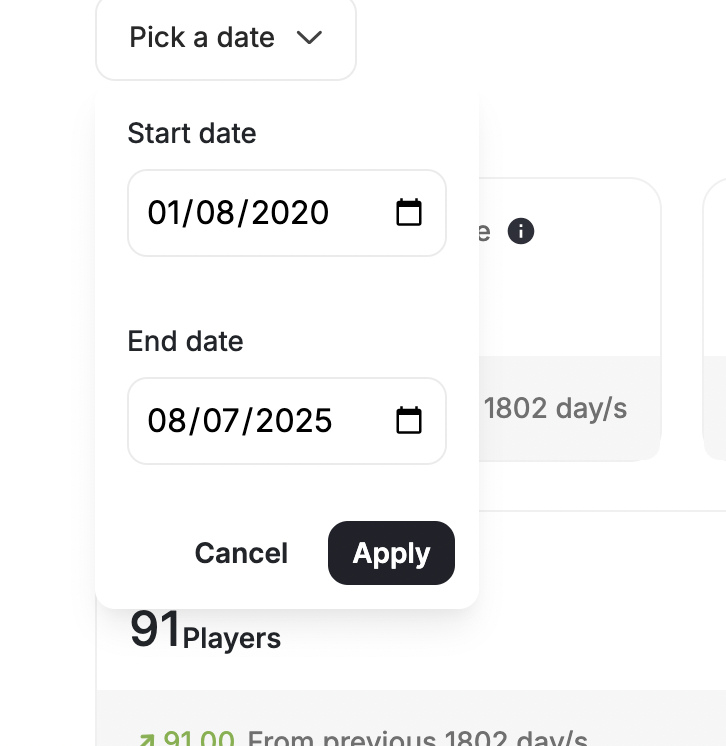
Filtering Reward Campaigns Insights
In addition to these metrics, you can adjust the period for which you want to view the data directly from the report.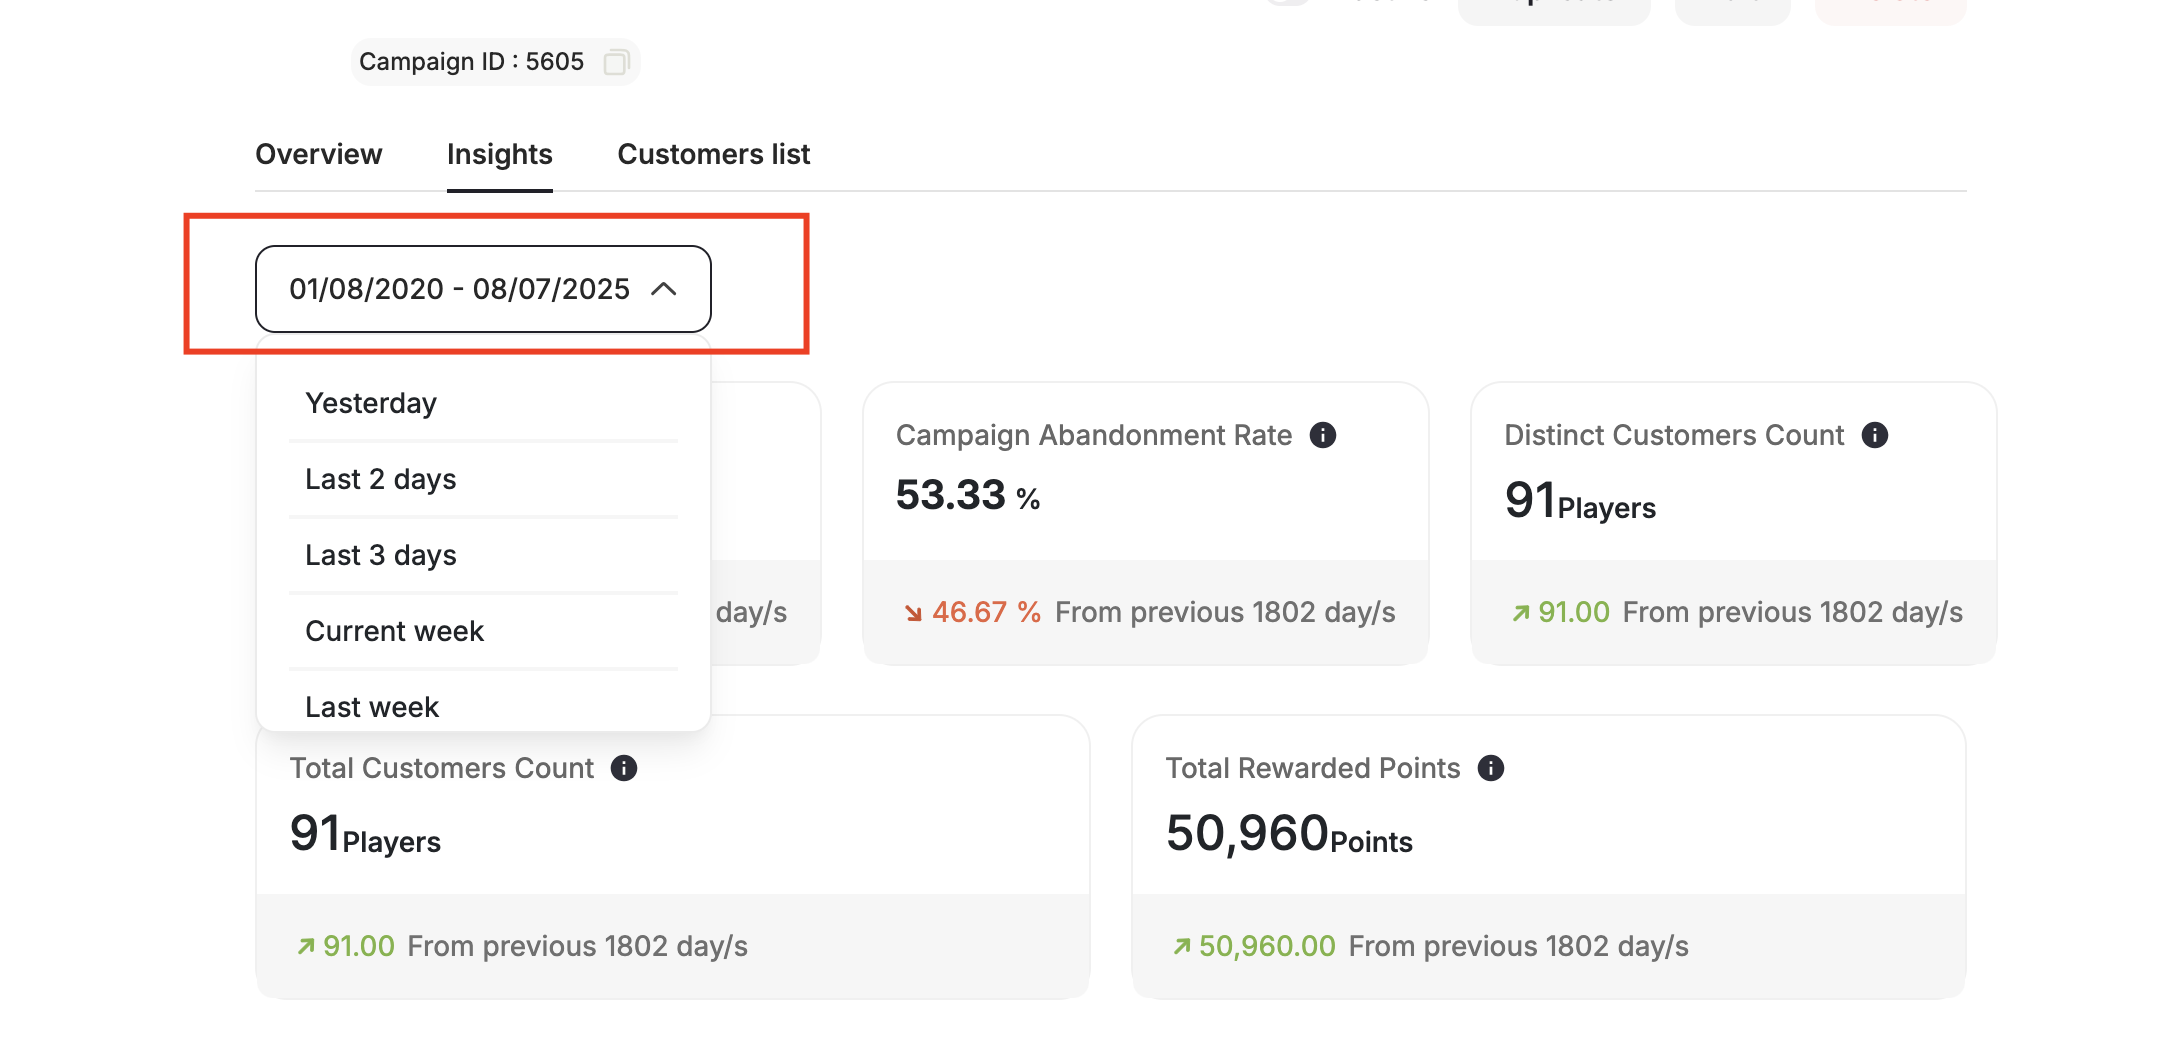
Related Articles
Create an Action-Based Reward Campaign
Step-by-step guide to building an action-triggered reward campaign from scratch.
Create a Time-Based Reward Campaign
Learn how to schedule campaigns around specific dates and occasions.
Create a Points Multiplier Reward Campaign
Set up a campaign that multiplies points earned on purchases.